TopCallStats
Analyze TopCallStats logs from your FileMaker Servers with interactive charts and tables to spot slow calls and diagnose performance issues.
The TopCallStats tool lets you analyze the TopCallStats log from your FileMaker Servers. Combined with FileMaker XMLs, you can inspect file structure and performance issues.
The TopCallStats tool is currently in beta and is subject to change. If you have any issues or feedback, please make a post in the Ottomatic Community Forum.
Uploading the TopCallStats log
To use the TopCallStats tool, you will need the TopCallStats log from your FileMaker Server. You can either:
- Get the log yourself and upload it in the TopCallStats UI, or
- Pull the log from your FileMaker Server in the UI. This option requires the server be connected to the Ottomatic Cloud Console and running OttoFMS.
Analyzing the TopCallStats log
Once you have a log uploaded, you can sort, filter, and search the log to filter down to time spans and long running calls.
Charts
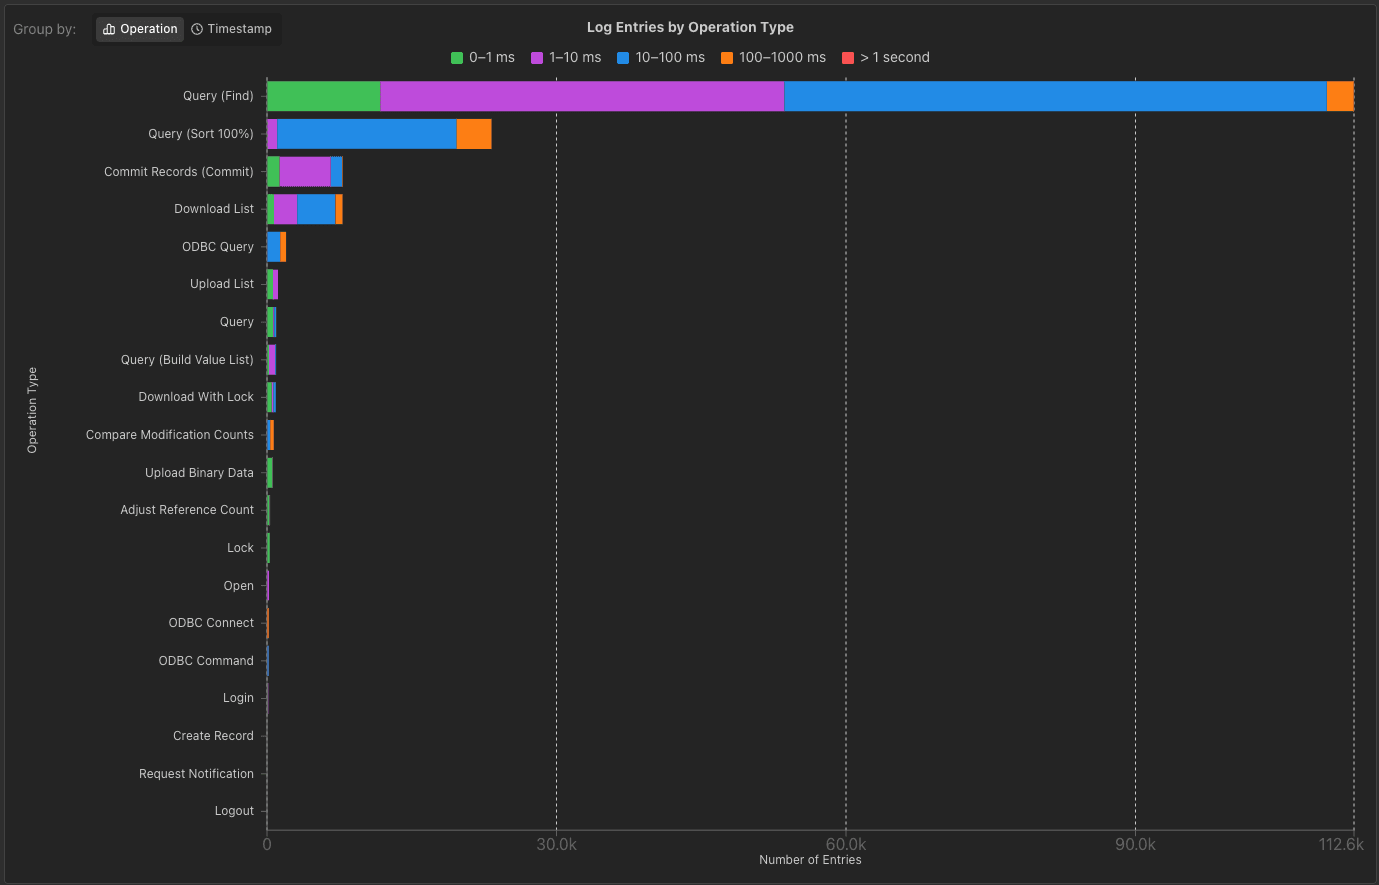
With a log uploaded, you'll see a chart of the top calls grouped by operation and elapsed time. This chart is interactive, and allows for filtering the data by:
- Clicking on individual bars to filter by operation and elapsed time
- Clicking on operations in the y axis to only show that operation, or
- Clicking on elapsed time ranges in the legend to only show that elapsed time grouping.
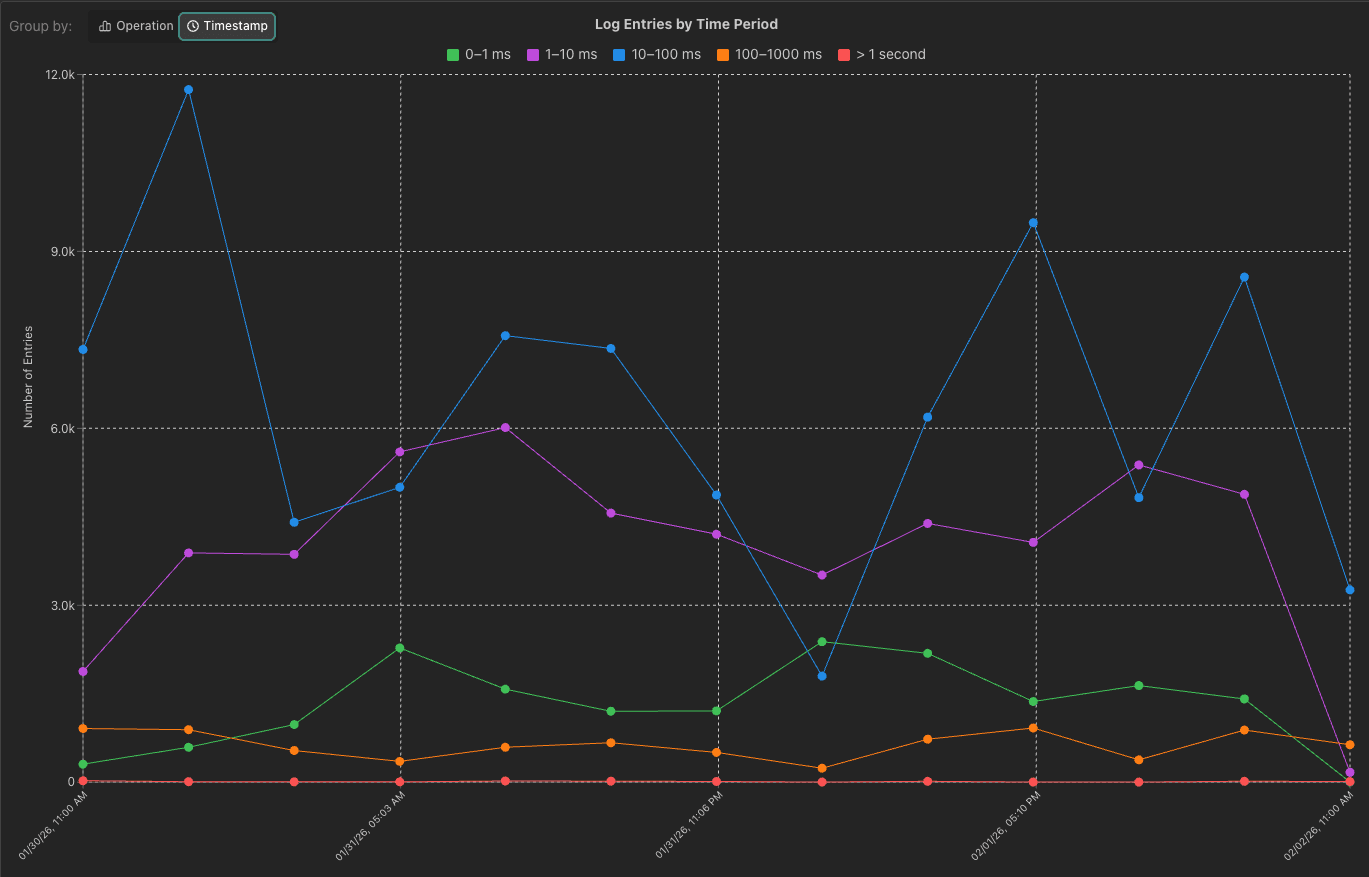
In the top left of the chart you can also switch to a timeline view of the data, which lets you see number of calls in each elapsed time bucket over time. This chart can be filtered by:
- Clicking on elapsed time ranges in the legend to only show that elapsed time grouping.
- Clicking and dragging on the timeline to select a time range to filter by.
Ottomatic Monitoring
If you have servers connected to Ottomatic, you can view monitoring information for those servers directly in the TopCallStats tool. You can view the last 48 hours of monitoring stats from your servers in the TopCallStats tool.
To get started, select a server and then select a log from that server. If you've selected a time range less than 24 hours within the last 48 hours, the tool will also display other logs alongside the TopCallStats data, giving you a more complete picture of server activity. To view more data in parallel, head to the Monitoring tab in the Server dashboard.
Other Server Logs
When viewing a TopCallStats log from a server, you can choose a different log on that server to be displayed aligned to the same time range selected in the TopCallStats log. This lets you correlate TopCallStats data with other server activity during the same period, making it easier to identify patterns and diagnose issues.
Log Table
Below the charts you'll see a table of the log data. This table can be used to filter and sort the data more granularly. The table will show you a single line per client request in the log.
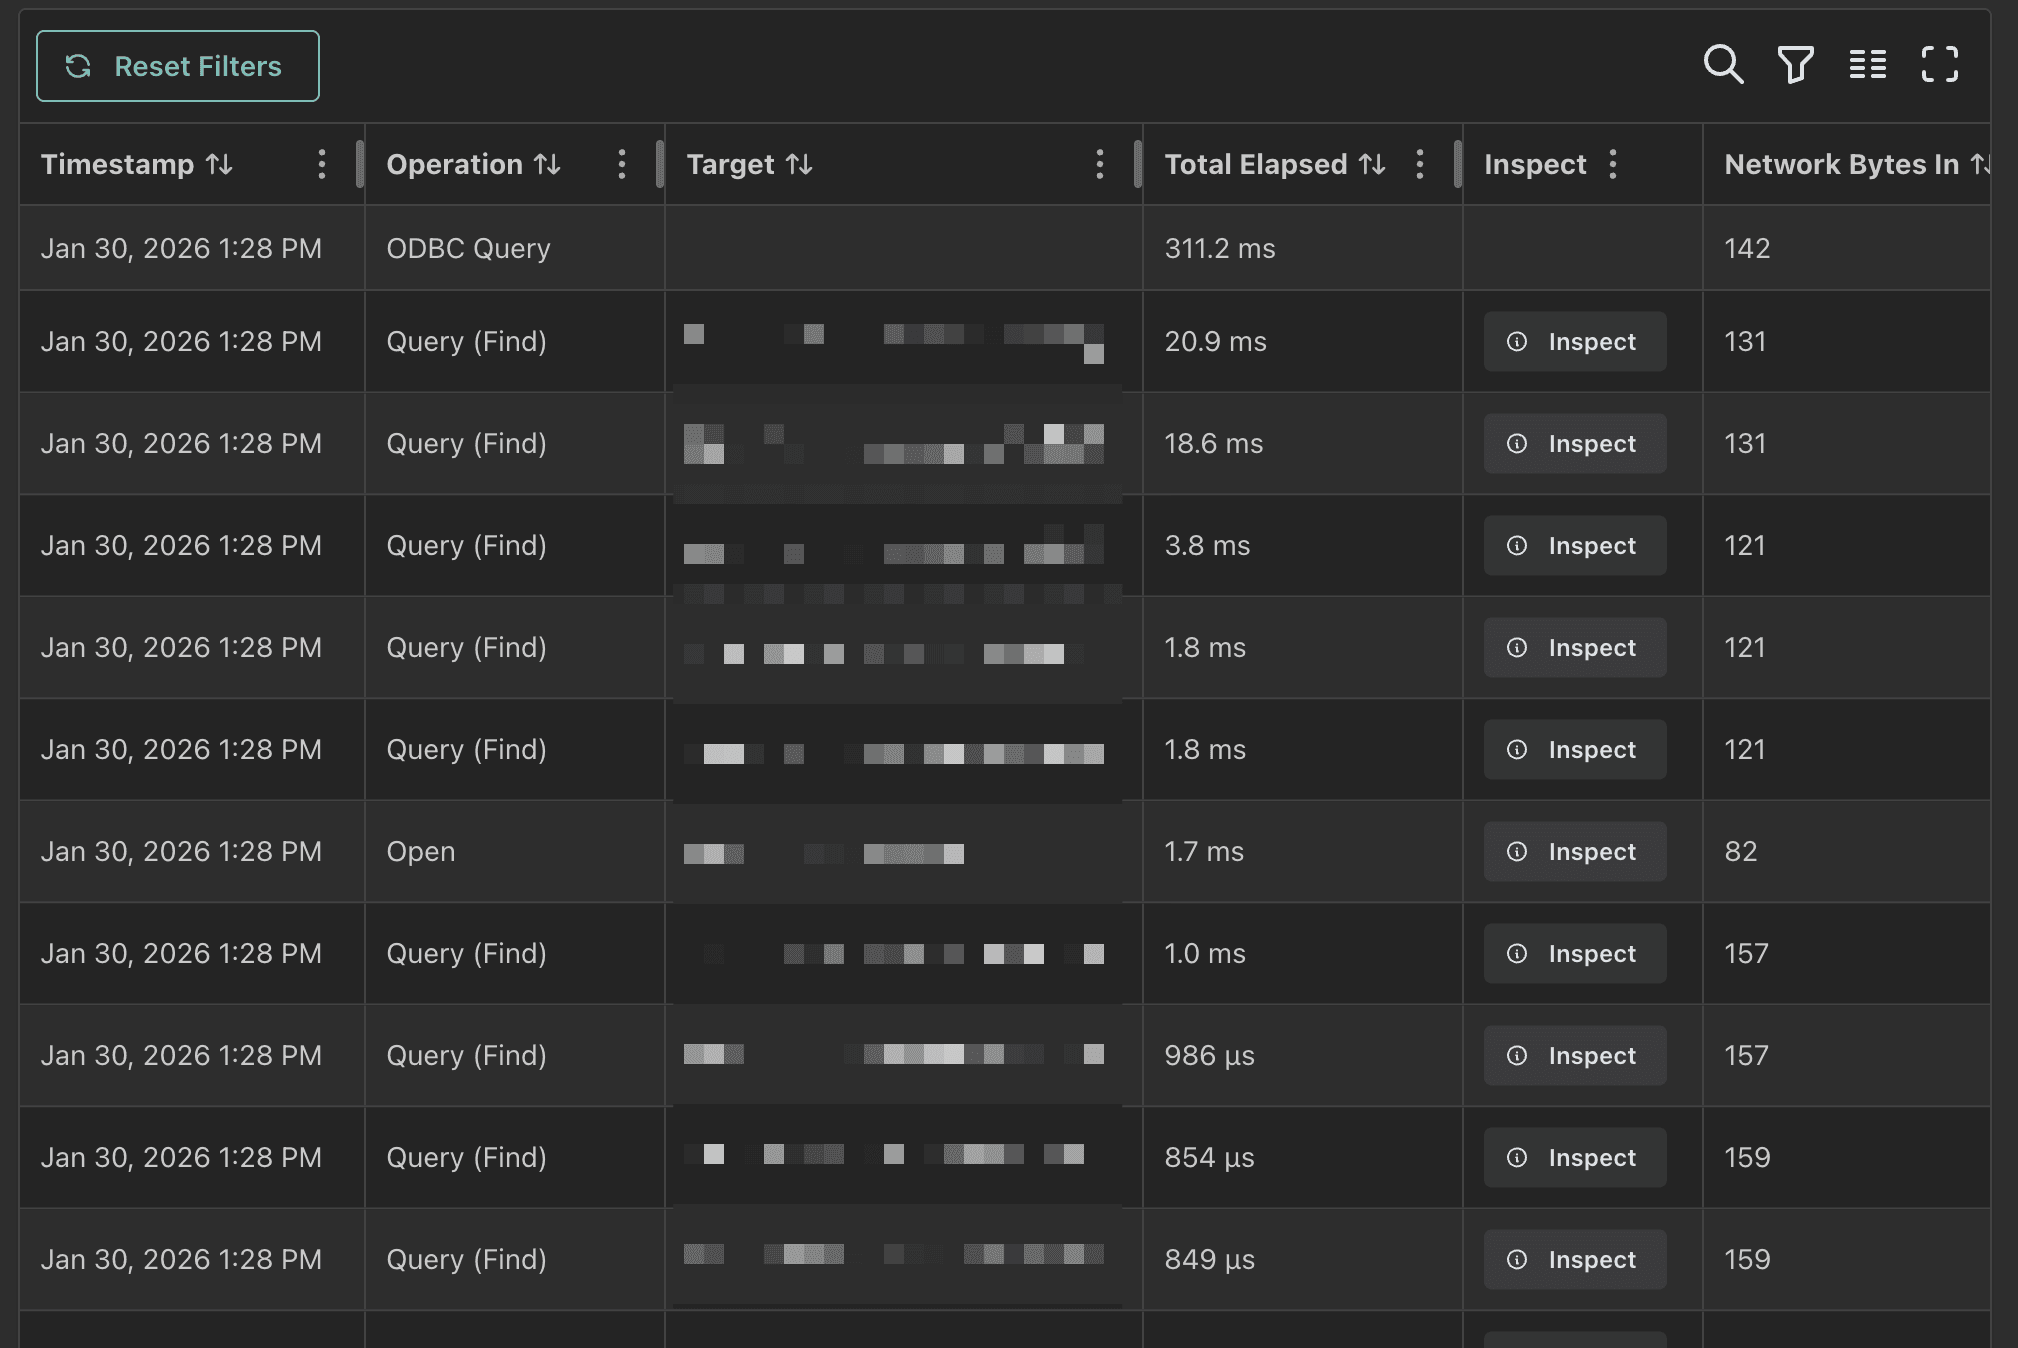
By default, the table does not show all columns, you can add all columns from the columns menu in the top right of the table. in the top right you can also search, display column filters, and make the table fullscreen.
Clicking on column headers will sort the table by that column. Clicking on the column header again will toggle the sort direction and then toggle off sorting for that column.
Filters that are applied from the charts will be reflected in the log table, and vice versa. For example, if you filter the timeline chart to a specific time range and then filter the log table to targets containing the word "dev", the timeline chart (and the operations chart) will only show requests that occurred in that time range for targets with the word "dev".
If a request takes longer than the collection interval (30 seconds by default), it will span multiple entries in the raw log. The table automatically combines these cross-section entries into a single entry for that request, keeping the longest duration, for a cleaner view.
You can also group the log table by target, which lets you expand and collapse each group to focus on the requests you care about. In addition, the Operation, Target, Client, and Client IP columns support include and exclude filter modes, so you can focus on or hide specific values. These filters also apply to the charts above the table.
FileMaker XMLs
In the base TopCallStats.log file, targets are listed by their id. For a table in a file, you might have a target of "file_name::table(234)". While this is useful for identifying the target, it is not very human readable.
To make targets more readable and enable more analysis, the TopCallStats tool can also ingest FileMaker XMLs. To upload an XML, you can either click the button at the top right of the screen for uploading XMLs, or you can click the upload XML button that appears when hovering over the inspect button for a target that doesn't have an XML.
XMLs can be uploaded manually or by pulling them from your FileMaker server using OttoFMS.
Pulling from OttoFMS
OttoFMS can take the full access credentials for your FileMaker file and create XMLs that work with the TopCallStats tool. By default, the option to pull from your server prefills with the server you pulled the top call stats log from (if any) and the files that appear in the top call stats log. If you only wish to pull XMLs for a specific file or subset of files, you can edit the file list.
If all files selected have the same credentials, you can choose to pull them all using the same credentials. If they have different credentials, you can switch over to "Different credentials per file" mode and enter then individually. Files can be pulled in multiple sets if necessary.
Inspecting targets
Once XMLs are uploaded or pulled from your server, you should see updated targets with the correct names instead of ids. For many targets, you can inspect it to learn more about the structure.
At the moment, you can inspect the following targets:
- Files
- Tables
- Fields
- Themes
While you can click the inspect button for script and layout targets, they currently take you to the file inspect screen. Support for inspecting these is coming soon.
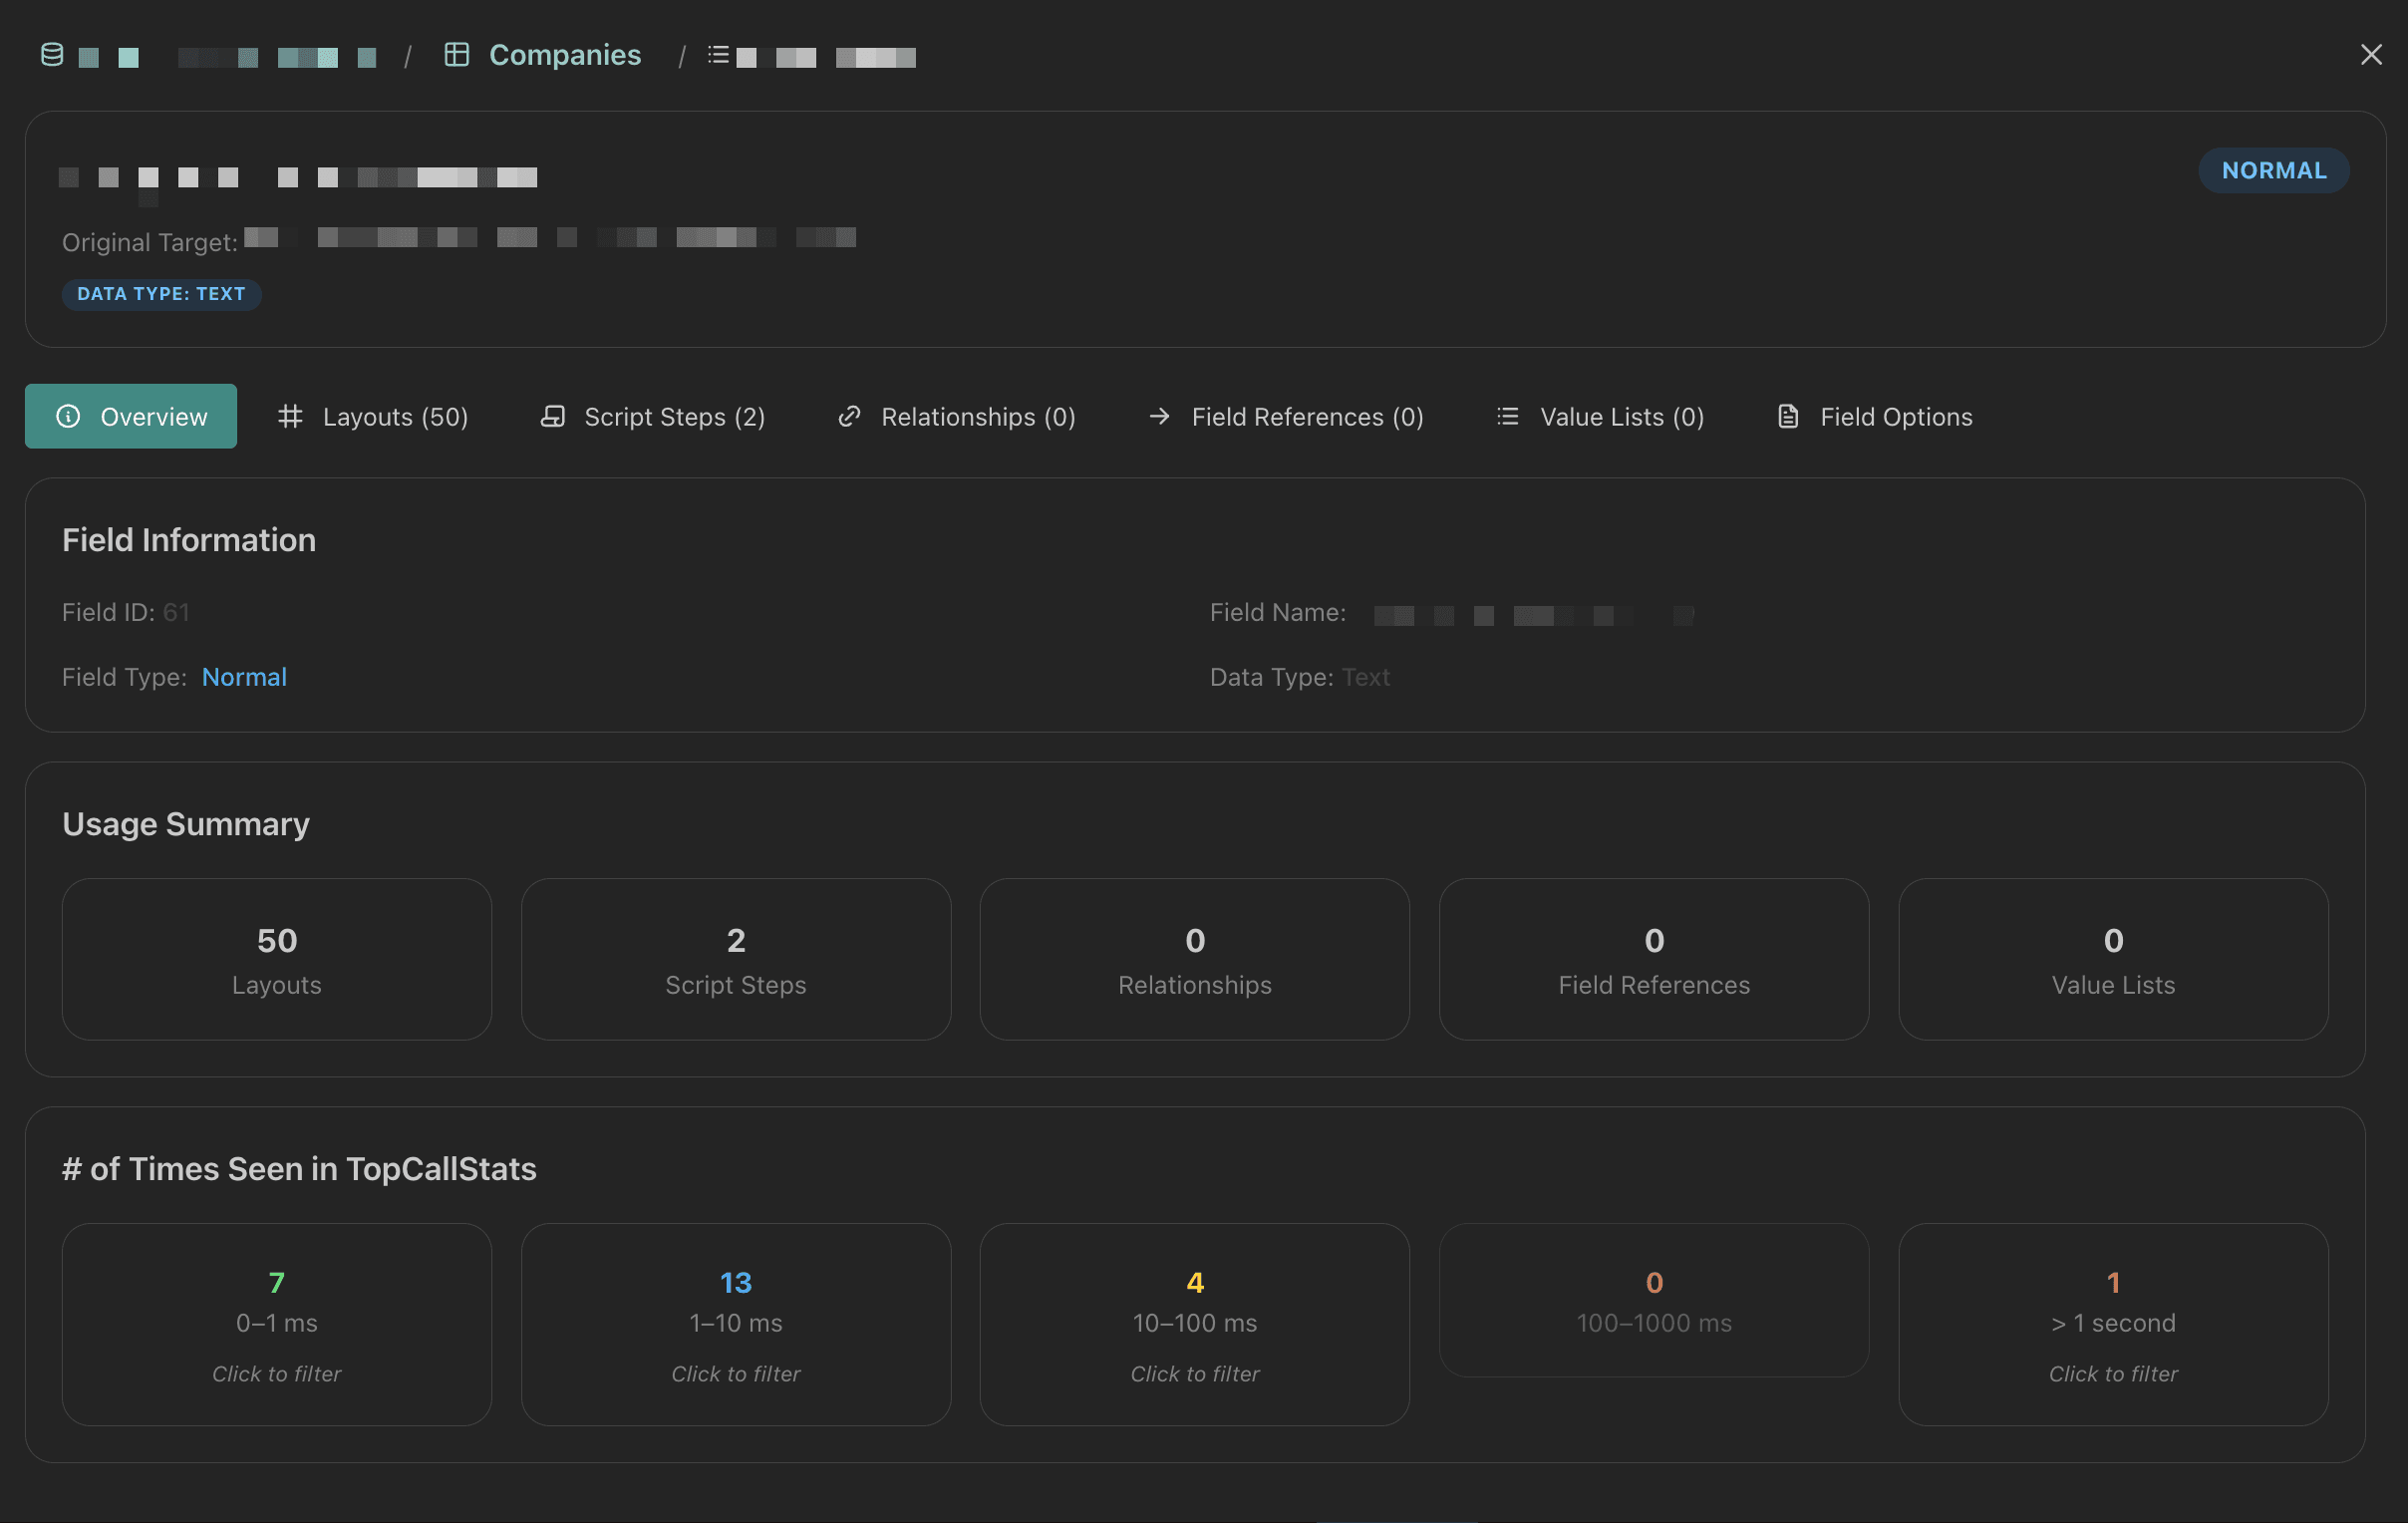
Within the inspect screen you can see where the object you're viewing is used. For example, fields will show you layouts, script steps, relationships, references, and more.
In the top of the inspect modal you can move to higher levels (ie. from field to table to file) and many screens will let you seek more information by clicking on a row in tables (ie. clicking on a table in the table list on a file will take you to the table inspect screen).
Was this page helpful?